When comparing SaaS providers, one of the key metrics that is often measured is the service response time. That response time, or latency, is a succinct measurement of the approximate time it will take for a response to be returned for a given query. Often, the major challenge in reducing response time is determining which service component is adding latency. At Service Objects, we are continually scrutinizing application optimization, network congestion, and monitoring real-time, real-world API calls to ensure our SaaS response times are second to none.
Our goal is to exceed availability and response times in our industry as a SaaS provider. We’ve invested in bank grade infrastructure and security, with data centers operating throughout the US. All of our databases are operating on the latest flash storage technology, returning query responses in less than 0.1s, and we are constantly enhancing and expanding our web server application pools. Bundle all of that with robust VMware clusters, multiple layers of network redundancy, and one of the industry’s only financially back service level agreements of 99.999% uptime and the result: we don’t just achieve industry standard availability and response times, we’ve raised the bar.
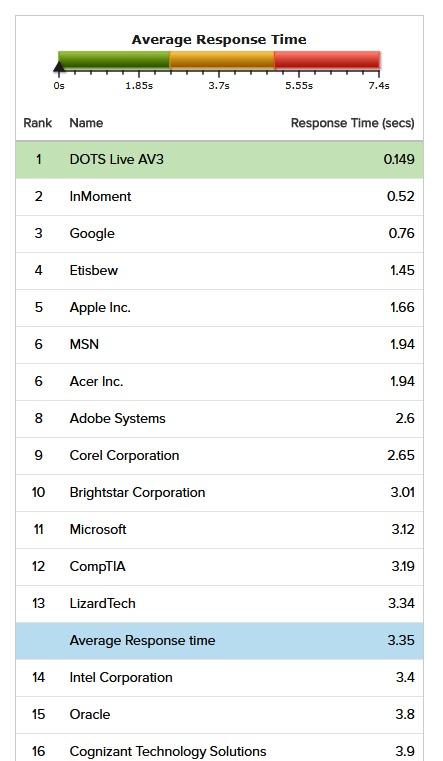
Third-party monitoring providers have ranked many of our DOTS Web Services average response times within the same echelon as leading tech companies, such as Apple and Google. In many cases, we are better than some of the biggest and well-known technology companies. Just how fast are we? If you are connecting from Los Angeles, our DOTS Address Validation service hosted in San Jose, CA boasts an incredible 0.089s response time. If your business is connecting from New York, we have you covered, with a lightning fast average response time of 0.27s from our New Jersey data center.
Service Objects recognizes how important it is to our customers to have little to no downtime. We are so committed to achieving this goal that we made Outstanding Network Performance one of our Core Values. We are continually monitoring our servers and measuring our response times, and as the graphic below illustrates, the results speak for themselves.


